The Telemetry Canvas
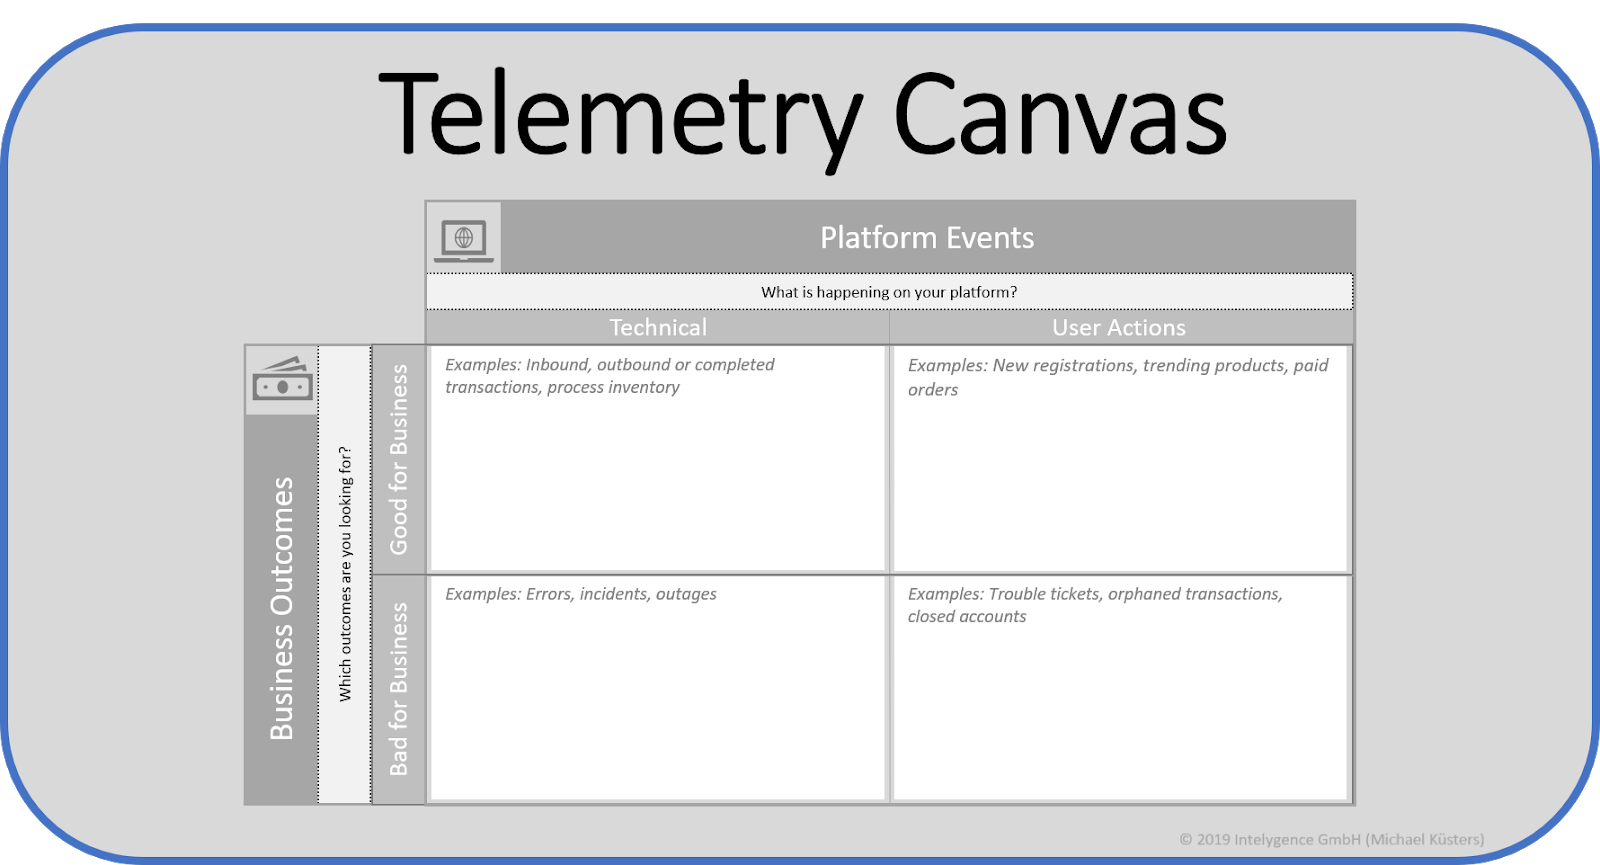
The canvas is simple to understand. There are two main dimensions:
Events
In an IT platform, there are mainly two types of events: Those created, conducted, orchestrated, managed or performed by automation - and those performed by humans (platform users).Anyone whose work is affected by events should have a say in defining the most relevant items for their work.
Technical events
Everything the system and/or platform does by itself, or in support of user activity, is a technical event. We can measure technical factors such as incoming or completed transactions, inventory levels et cetera. Of course, we can categorize these by transaction type, technical component or business scenario, depending on what we are looking for.Quality checks, build failures or network alerts are also technical events that occur frequently, and require attention.
User actions
Whatever users do may also be relevant to the performance of our organizations. If our goal is to grow our userbase, new registrations are a great metric to look at. On a marketing campaign, the next logical extension would be lead conversions. Or trending products. We might also look at revenue generation - and whatever has an impact on things we care for.Even abandoning our product is relevant for our business performance, and can be classified as "action by inaction", potentially being a relevant user action.
Business outcomes
Events by themselves are meaningless. They derive their meaning by their impact on our business.Good for business
We are looking for certain events, such as the successful start or completion of a transaction or the generation of revenue. Many of these events fall into the category of "The more, the merrier". The best events are those that cause no work, yet generate profits.Bad for business
Some events are always bad news, for example complaints, technical errors or system outages. Even if nobody likes to have these, they are part of working reality, and we need to pay attention to the effort we sink into them.In many organizations, the invisibility of the "bad news" metrics on the radar causes the organization to accumulate technical debt that may eventually kill the product or even the entire company!
The best businesses aren't those who successfully ignore the bad news - it's those who know that they have less bad news to handle than they can stomach!
Deriving metrics
Once we know which events we're looking at, we can determine how we measure them.
For example: When a transaction arrives in the system - we also want to know when it is completed: we measure not just our transaction rate and inventory, we need to know the throughput rate as well. This gives us visibility into whether we're accumulating or reducing backlog, whether we're sustainable or unsustainable!
Optimization
Once we have defined our metrics, we can set optimization goals. Some events are good for our business, others are bad. The general optimization direction is either "lower is good" or "higher is good". In rare cases, we have range thresholds, where neither too high nor too low is desirable.
The easiest way is to start by capturing data on the current state of a metric, then answering the question: "Is this a problem? If so, how big is it?" - determining whether the current value is good, acceptable or inacceptable.
Using the Telemetry Canvas
Step 1: Invite stakeholders
Bring all stakeholders in your product together, preferably not all, but representatives from each group. This is a non-exhaustive list of people you might want to involve:- Salespeople, who generate income from the product
- Marketeers, who drive the product's growth
- Finance, who validate the product's revenue
- Developers, who build the solution
- Operations, who have to deal with the live system
- Customer Service, who have to deal with those who bought it
- UX, who design the next step
- Legal, who definitely don't like to have trouble with the product
The more of these functions rest within your team, the easier this exercise will be - although typically, most will be located somewhere else in the organization.
Step 2: Brainstorm events
Give everyone the opportunity to draft up events that are important to their work. There is no "right" or "wrong" at this stage, and there are no priorities, either.
It's important to remember that not all events occur within the platform, some occur around the platform, and that some events can also be caused by inaction.
Get people to write each event on sticky notes.
Step 3: Locate events on the matrix
People tend to have a pretty good understanding whether an event is good or bad, so where to place the event on the vertical should be easy. In some cases, it's unclear whether an event is good or bad - then default to "Bad", because every event means data processing and work, and work that's not good is probably a bad thing.
Likewise, define the horizontal category. In some complex systems, it's unclear whether it's a user action or a technical event. Try defaulting to "user action" - you haven't discussed where to get the data from, anyway.
Step 4: Define measurement systems
As events themselves are of no value, we need to define the measurements that we want to derive from events. These can also be combination metrics, such as "Lead Time" or "Inventory Growth". What matters is that everyone in the room can agree on what would be measured.
Write each of the measurements onto post-its and put them into the field corresponding to one of the event(s) they rely on.
Step 5: Prioritize
Not all metrics are sufficiently important. Let each stakeholder name up to three metrics that matter to them - you still need to put work into setting up data collection, and it doesn't help you to have five hundred things on your "toDo" list.
This is not a point-based system, so it's not about dot-voting, so you end up with a bunch of individual priorities.
Although it's good if multiple stakeholders value the same metrics, since that reduces complexity, it's not necessary that stakeholders agree on the value and importance of metrics.
Step 6: Validate
You should have a number of metrics in each quadrant now. If you're missing one of the quadrants, your measurement system is probably biased. Should that be the case, ask, "What are we missing?" Try reprioritizing metrics until you have at least two in each segment.
Step 7: Agree and align
Get everyone to agree that they have their most important metrics on the canvas. Address potential concerns. If necessary, re-iterate that this is not intended to replace current measurement systems nor a final version - it's just the beginning of a journey to align on data transparency.Step 8: Invite for follow-ups
Once the metrics are agreed, let everyone know that there will be different sessions to define the metrics in more details, that is: how the data will be collected, how it will be interpreted and how it will be represented. This consumes more time and is not in full detail interesting for everyone.Step 9: Agree on Next Steps
The Canvas is ready, but it's just a canvas. Make sure you have an action plan of what will happen next. Here's what is suggested:1. followup sesssions for defining the metrics,
2. do some implementation work to measure them,
3. present the metrics in a Review,
4. start using the available metrics in decision making,
5. Inspect, Adapt and Improve.
No comments:
Post a Comment